
The Remittance Matrix: Price, Channel And Corridor
~6 min read

For many, international remittances are a financial life-preserver. Transfers initiated by diaspora or migrant communities buoy up and stabilize the incomes for populations at risk of economic volatility. In 2016 alone, flows worth $575 billion crossed nations' borders, and of that aggregate, $429 billion were destined for developing countries. It is no wonder, then, that the G20 initialed a pact to beat back the average cost of a remittance to 5 percent of the total value. (The UN has an even more ambitious goal of 3 percent by 2030). But, a confluence of factors influences prices. What price disparities exist between corridors, and do differences in channel account for the unevenness?
Disentangling The Web
As it turns out, there is a great deal of price fluctuation in the cost of remittances, especially in the context of geographical corridors. According to the Q3 2017 data released by the World Bank, Sub-Sahara Africa (SSA) and East Asia and the Pacific (EAP) still sit at the top of the pile with inbound remittance costs coming in at 9.08 and 8.03 percent respectively. Interestingly, Latin America and the Caribbean (LAC) and South Asia (SA) have remained the two cheapest routes for in-going money since Q4 2015, with Q3 2017 mean prices for the duo dipping to 5.68 and 5.43 percent.
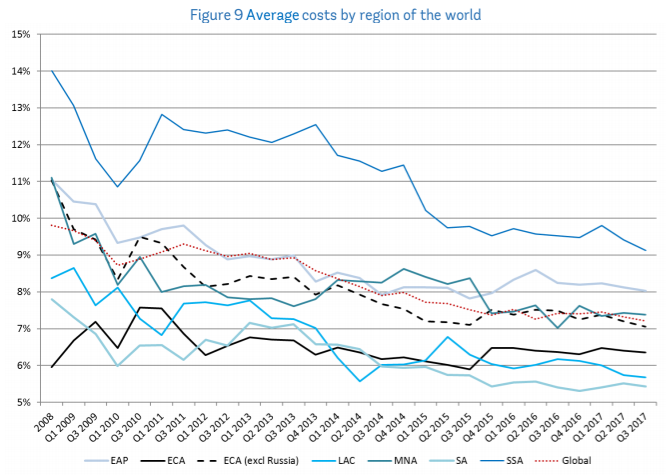 Source: World Bank, Remittance Prices Worldwide Issue 23
Divergences exist, too, when price is isolated to channel. Of little surprise, shuttling capital through banks is nearly twice the price of the next worst option, post offices, with fees equivalent to 11 percent of the remittance. Post office and money transfer operators (MTOs) boast slightly more stomach-able price propositions, at 6.56 and 6.14 percent specifically. Mobile operators continue to 'wipe the floor' in the remittance arena, collectively processing service requests for 3.10 percent.
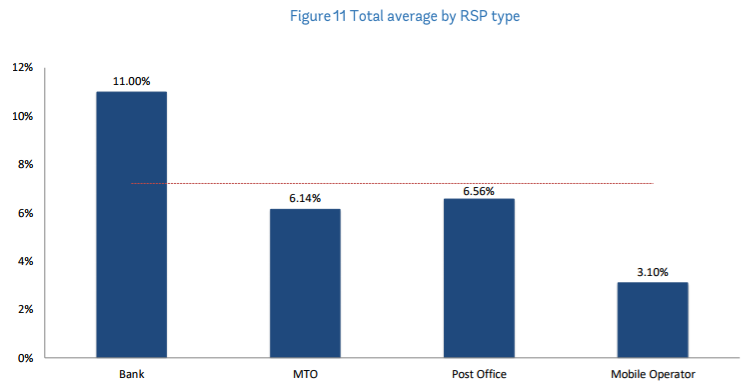 Source: World Bank, Remittance Prices Worldwide Issue 23
Even the payment-instruments involved in both financing an international transfer and facilitating it are correlated with varying price outcomes. In line with the channel cost-structures above, bank accounts remain the remittance rip-off. The one exception to this is same-bank movements of money, which squeezed past as a mildly more cost effective mechanism than cash in Q2 2017. Mobile money is still the unrivaled 'steal,' especially as the gateway to the digital remittance ecosystem (see below).
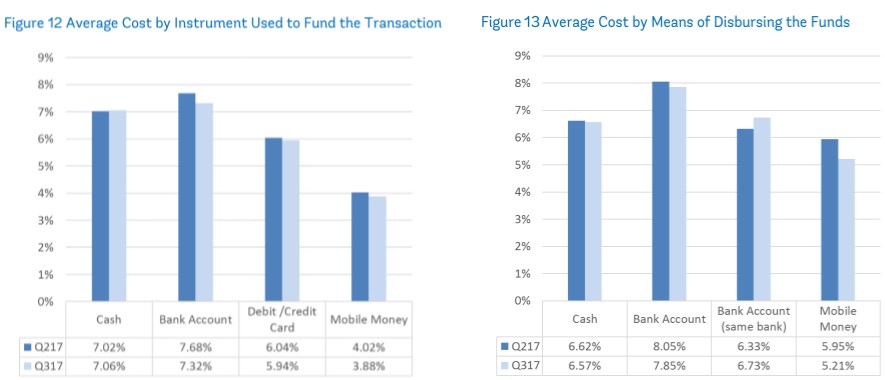 Source: World Bank, Remittance Prices Worldwide Issue 23
Correlation Does Not Equal Causation
Now, when Figure 9 and Figure 11 are reviewed side-by-side, an almost 'obvious' insight might jump out. Perhaps, regions that have bottomed out closer to the 5 percent mark have done so as a result of the channel. The higher the frequency of cross-border mobile money deployments should surely translate to savings across the remittance board? Conversely, if corridors are highly saturated and littered with bank offerings, that would be reflected in price averages?
Unfortunately, the World Bank data is testament to the complexity behind remittance pricing. Latin America and the Caribbean (LAC) - a more budget-friendly recipient corridor according to Figure 9 - had 2,498 entering transfer services, and of those 325 were powered by banks while 2,114 were handled by MTOs. There were no services headed by mobile operators. How LAC's remittance prices balanced out to 5.68 percent when composed almost exclusively of MTO (6.14 percent) and bank (11 percent) providers is a bit of a head-scratcher.
But therein lies the convolution. While technology can certainly shrink operating expenditures, there is no guarantee that the extra change is tucked back into the customers' pocket. Banks and MTOs in the LAC corridor have either happened upon a way to offer remittances at a significantly lower-price point than their counterparts in Sub-Saharan Africa (SSA), or a lack of transparency and competition is feeding into what looks suspiciously like price gouging in the latter.
The ratio of bank, MTO, mobile operator service providers active in the remittance market, for example, is strikingly similar between SA (780 banks, 3077 MTOs, 41 mobile money enabled products) and SSA (632 banks, 2523 MTOs, 37 mobile money enabled products), the high and low ends on the remittance price spectrum. It stands to reason, then, that channel is only one part of a variable-heavy equation. Other more invisible variables - in addition to aforementioned competition - might include regulation or the sophistication of financial infrastructure.
The SmaRT Indicator
There is another way, however, to bring the G20's goal to fruition. In a straightforward and option healthy marketplace, it only requires one or two thrifty, but quality comparable alternatives to undercut the whole system. Average price as a whole becomes irrelevant if remittance flows migrate to one or two services. The global weighted average remittance price - which factors in the relative sizes of streams vis-a-vis price - reaffirms this conjecture. According to the Q3 2017 data, the global weighted average is 5.46 percent, almost two percentage points less than the unweighted average.
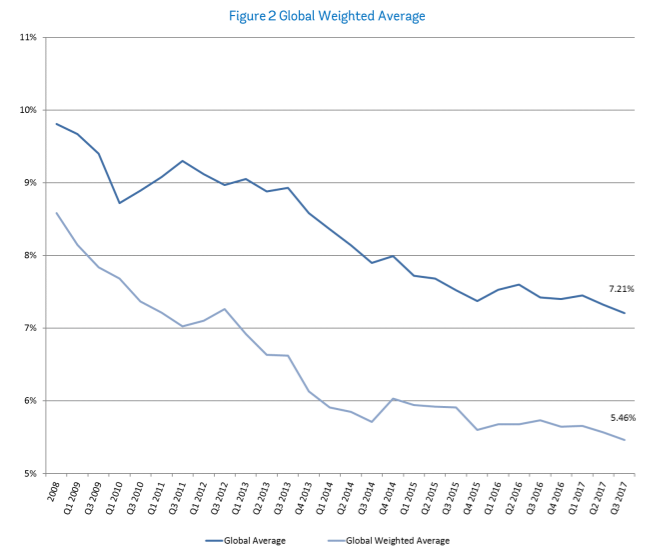 Source: World Bank, Remittance Prices Worldwide Issue 23
The World Bank's SmaRT Indicator is an attempt to capture the reality of savvy, shopping-around customers and calculates the average price of the three cheapest remittance products in any given corridor. Of course, in order to be eligible as a SmaRT remittance service, other baselines must be met. Peripheral considerations also measure transaction speed (five days or less), geographical proximity to agent or bank branches and access to technology fundamental to trigger the transfer (bank account, mobile phone or the internet).
When remittance costs are boiled down to only SmaRT inputs, the average price plummets to 5.80 percent. Pervasiveness of services that fall under this category, however, ranges widely across corridors. As of Q3 2017, 58 of the 365 corridors had no SmaRT compliant remittance products (22 to SSA, 14 to SA, and 12 to MENA), a nagging obstacle to both the G20 and UN's long-term 5 and 3 percent targets.
Mobile Money To The Rescue?
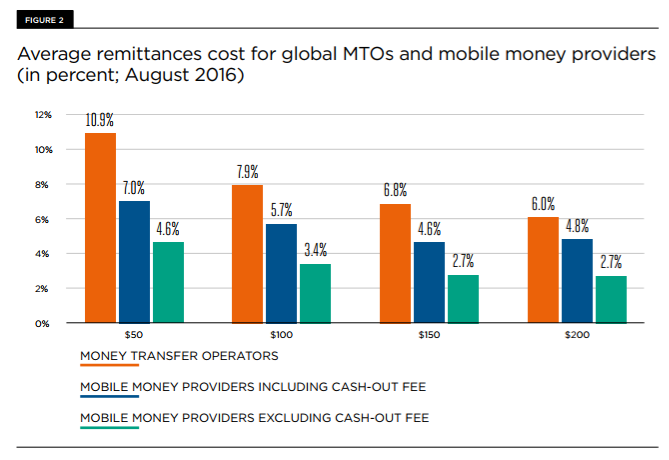
While the World Bank data may not definitively prove a causal relationship between channel and price, research by the GSMA, on the other hand, explicitly singles out mobile money as an unparalleled agent of change. According to its report, mobile money remittance deployments are especially attractive due to two observations: its competitiveness of fees for low-value transactions and its spill-over impact on lowering MTOs' overall prices.
 Source: GSMA, Driving A Price Revolution Mobile Money In International Remittance
To the first tenet, as the graph above exemplifies, the cost of a $50 mobile money remittance, even when saddled with a cash-out fee, is approximately 4 percentage points under that of MTOs. For low-income migrants, that renders the prospect of sending home more frequent but smaller lump-sums more tenable. Although the differential creeps closer to equilibrium as the value climbs, MTOs still have ground to cover to match mobile money enabled products.
That, in and of itself, theoretically creates a more cutthroat environment, and further incentivizes MTOs to drop prices. And, that is exactly what the GSMA has claimed to find. In corridors where MTOs competed directly with mobile money providers, their average price hung at 6 percent, versus 8.2 when MTOs were left to their lonesome. This suggests that the ever hard to nail down variable of competition might have the loudest voice of all.
Therefore, hubs that foster interoperability between international mobile operators (like MTN Côte d’Ivoire and Airtel Burkina Faso) are perhaps the most concrete way forward to tackle remittance prices, and MTOs' ferocious grip on them. But - mobile money may not be the only innovator on the horizon. What if the next phase of remittances' development isn't MTOs against mobile money providers, but mobile money providers against blockchain solutions? Or, maybe, it will actually culminate in collaboration - a mobile money front-end and a blockchain back-end? Needless to say, the closer we are to a future where competition can no longer account for a 2 percent price effect, the better.
Image courtesy of Nicolas Raymond.
Click here to subscribe and receive a weekly Mondato Insight direct to your inbox.
Cash Is King, But Are Checks His Queen?
Is Your Country Ready To Go Cashless?