
Aid Cycles And Financial Inclusion: Making A Dent?
~6 min read
Financial inclusion as an international policy objective didn't fully materialize until 2009, when delegates from 60 low- and middle-income countries convened in Nairobi to found the Alliance for Financial Inclusion (AFI). Shortly thereafter, Queen Maxima of the Netherlands was appointed to a newly minted position at the United Nations, Secretary-General’s Special Advocate for Inclusive Finance for Development. The final cherries on top of the international financial inclusion agenda sundae, then, were the Maya Declaration and the G20's formation of the Global Partnership for Financial Inclusion, with AFI, the Consultative Group to Assist the Poor (CGAP), and the International Finance Corporation (IFC) at the helm of implementation.
This signaling, however, has translated to more than just vague overtures or shiny placements. Multilateral organizations, foundations and national aid bureaus have earmarked significant funds to initiatives furthering financial inclusion. But, what are the year-on-year flows, to whom are the recipients, and to what degree can their impact be quantified?
The Five Ws
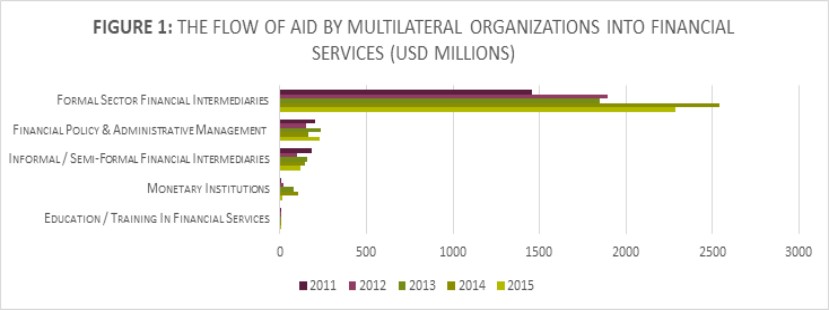
Harking back to elementary school days, the framework of the five Ws (who, what, where, when and why) can contextualize the massive movements of aid. In 2015 alone, some 49 multilateral organizations dispersed a total 2,649 USD million to the banking and financial services sector of developing countries. That value represents a 42.8 percent increase from 2011, which witnessed 1,855 USD million allocated to the equivalent category.
 © Mondato 2017, Analysis of OECD Data
A significant majority of the resources is funneled into formal sector financial intermediaries, with financial policy and administrative management a distant second. Informal / semi-formal financial intermediaries are a competitive third, and investment in monetary institutions had grown in popularity, that is until the sharp drop off in 2015. Education and training in financial services is the most neglected of the sub-divisions, and its future trajectory is bleak.
Of particular interest, though, are the “beneficiaries” (whether intentional or not) of each form of aid. Formal sector intermediaries engage in financial activities such as legacy banking, credit lines, insurance, leasing, venture capital and more. Informal sector intermediaries, conversely, specialize in micro-lending, savings and credit.
Therefore, aid to the former would likely impact financial development, which speaks to macro-level indicators like the size of the stock market or a country’s ratio of credit to gross domestic product (GDP). Aid to the latter, instead then, would have a much more direct effect on rates of financial inclusion, or the delivery of affordable and accessible financial services to disadvantaged and low-income populations. To further corroborate this hypothesis, further segmentation of multilateral donor organizations resulted in a dramatically different distribution of aid.
 © Mondato 2017, Analysis of OECD Data
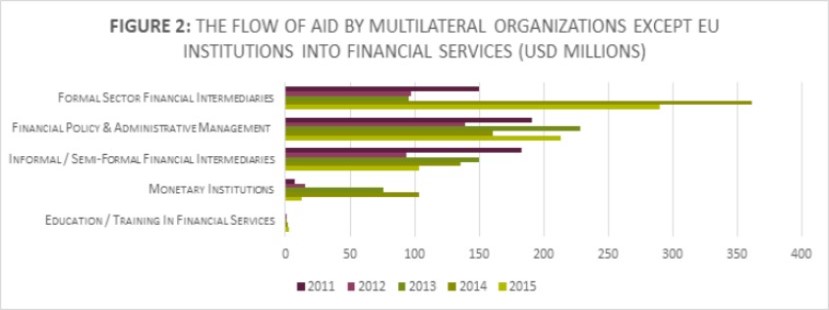
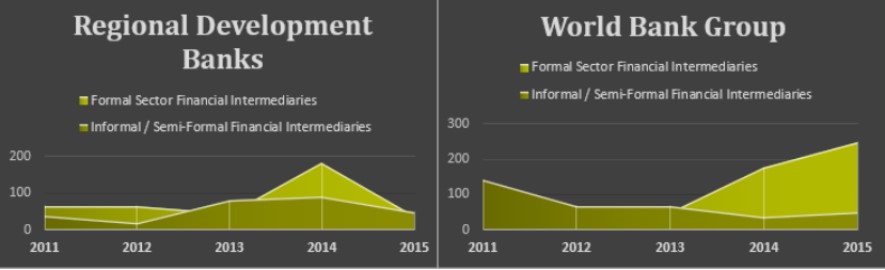
With the removal of EU institutions from the dataset, the spread of aid is more balanced and less lopsided. Even on the least proportional year (2015), the informal / semi-formal financial intermediaries to formal sector financial intermediaries ratio is 35.5 percent, versus 5.25 percent when the same statistic is generated for 2015 from Figure 1. Snapshots from Regional Development Banks, like the Asian or African Development Bank, and World Bank’s dossier mirror this phenomenon (see below).
 © Mondato 2017, Analysis of OECD Data
The Big Business Of Aid
With such consequential aid injections coursing into the international development arterial network, breaking down the value and patterns of spending is the first step in hypothesizing if the aid is transforming into sustainable financial service propositions or padding business models.
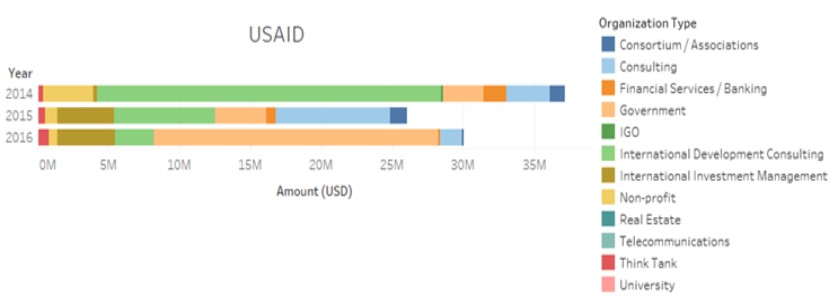
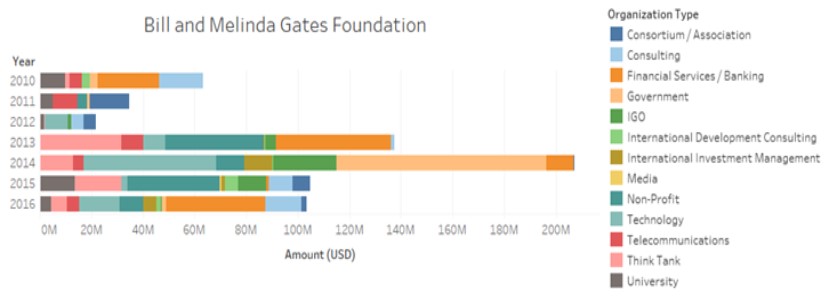
In order to further investigate the breakdown of aid influxes designed to promote financial inclusion, the data of United States Agency for International Development (USAID) was limited to allocations to informal / semi-formal financial intermediaries (micro credit, savings, and credit co-operatives). A similar exercise was also replicated for Bill and Melinda Gates Foundation. Due to the disparate systems of tagging, however, data from the latter organization was restricted to aid demarcated under the “Financial Services for the Poor” Program.
 © Mondato 2017, Analysis of foreignassistance.gov
USAID, historically, has relied on well-entrenched consulting (Deloitte, Booz Allen Hamilton, Financial Markets International) and international development firms (Chemonics, Pragma Corporation) to spearhead the operational components of programs facilitating financial inclusion.
This strategy, however, somewhat shifted in 2016, with the bulk of USAID’s money dedicated to financial inclusion campaigns gobbled up by one initiative – the State Department’s partnership with the Egyptian-American Enterprise Fund (EAEF) to a tune of nearly 19 USD million. Along with increased government involvement, the role of think tanks, although marginal when considered in context of the total aid value, is becoming more prominent.
 © Mondato 2017, Analysis of Bill & Melinda Gates Foundation Data
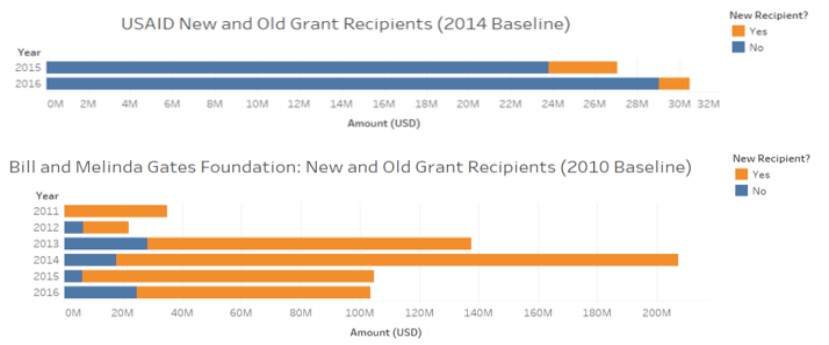
While Bill Melinda Gates Foundation, too, has utilized the expected consulting and international development firms, it does so at a much lower frequency than that of USAID. In fact, Bill and Melinda Gates Foundation often works with developmental banks (Islamic Development Bank, International Bank for Reconstruction and Development) or telecommunication providers (MTN, Telenor, Vodacom) in the targeted country directly. That, and Bill and Melinda Gates Foundation will furnish solution vendors (Ericsson, Huawei, Mastercard Labs) with funding to solve a particular technology challenge related to financial inclusion, which differentiates it from USAID orthodox. The former, in addition, has a much less repetitive portfolio and a higher year-to-year turnover rate of grant receiving organizations.
 © Mondato 2017, Analysis of foreignassistance.gov and Bill & Melinda Gates Foundation Data
Where the two overlap, though, are the sporadic disbursements to foreign government entities (Universal Postal Union of Germany, BANSEFI), and the usage of Think Tanks to tackle theoretical or impact measurement problems.
Plugging Holes Or Sustainable Development?
The quasi-political nature of which organizations receive funding is, by itself, enough of a reason for extra diligence in tracking money and financial inclusion outcomes. While pouring resources into the same groups is not necessarily inherently bad, more data is required to confirm the aid's performance. That endeavor, however, is muddled by two realities: the grayness surrounding what constitutes financial inclusion specific programs and the lack of high-level estimates ball-parking the number of the unbanked.
The first point is underlined by the conclusions forwarded in CGAP's annual Cross-Border Funder Survey. According to the brief, which is substantiated by the self-reporting of 54 international funders, 34 USD billion was committed to financial inclusion initiatives in 2015.
Currently, at least eight of the largest funders are revisiting their financial inclusion strategies due to the changing perception that financial inclusion is not a stand-alone goal, but an enabler of other externalities like access to education or energy. Therefore, many funders are integrating financial inclusion directives into less obvious programming, thereby complicating methodologies to pin money to black-and-white results. This logic would justify, for example, the encompassing of much more than just aid channeled to 'informal financial intermediaries' as financial inclusion oriented campaigns. This, in part, explains why CGAP caveated within the brief itself that the self-reported data was not perfectly comparable to OECD data.
And even if more standardized interpretations of financial inclusion programming emerged, the backdrop metric, account ownership, is only updated on a country or region scale once every three years by the Global Findex. When the Global Findex was updated in 2014 from the 2011 version, the number of unbanked adults slid from 2.5 billion to 2 billion.
However, much of that progress is attributed to mobile money, which, while receiving a helping hand from the public sector (according to CGAP, only one in ten projects involves mobile money operators), is also the product of commercial forces and profit. This leaves the door a bit too open in terms of wondering what the acquisition costs per head were of each new account open for public donors.
In order to get to the bottom of these questions, though, a happier medium must be struck, as the Global Findex alone cannot elucidate what financial inclusion strategies work, and in which contexts. CGAP has further broached the subject through its publication of "Measuring Market Development," a handbook for funders and implementers of financial inclusion programs. But, more sophisticated organizational-level monitoring and evaluation tools are only the starting line. Collaboration among stakeholders at a city level, national level, and even regional level is the throttle in the race to unearthing program superstars and duds.
Image courtesy of United Nations Photo
Click here to subscribe and receive a weekly Mondato Insight direct to your inbox.
Is Fintech Challenging the Payday Loan Industry?
Data Protection In Europe: GDPR Looms