Alternative Delivery Channels: KPIs Unknown?
~6 min read

A few short weeks ago, Mondato debated the fate of the bank branch, an institution some in the digital finance space brush off as an eventual relic. While behavioral analytics cast a more nuanced shadow of consumer psychology - with a resounding 62 percent of survey respondents adamant about access to a local branch in the United States - facts on the ground suggested that the changeover to Alternative Delivery Channels has begun on a global scale.
And while banks in advanced economies often have the luxury of 'data-rich' guide rails in the migration, Financial Service Providers (FSPs) in emerging markets, especially those centered on unbanked segments, are often in the dark about the financial and operational impact of introducing Alternative Delivery Channels (ADCs). To add further murkiness, not only are individual firms at times either at a loss of what data to collect or technologically powerless to do so, there are no industry-wide benchmarks to help signal what a successful deployment of Alternative Delivery Channels (ADCs) actually looks like.
To remedy this, MIX, with support from the Mastercard Foundation, IFC and UNCDF, sought to both formalize key performance metrics and cross reference the data from 16 FSPs in Sub-Saharan Africa.
A Definitional Quagmire
Similar to the semantic tug-of-war that went along with deciding the meaning and scope of digital finance, too has it proven difficult for the industry to put a finger on the exact definition of an Alternative Delivery Channel (ADC). Literature from a diverse set of stakeholders - from the IFC to the Bankable Frontier Associates (BFA) - is melding the concept of ADCs into a fairly straightforward and uniform narrative.
In layman's terms, ADCs are representative of any channel that is not a traditional brick-and-mortar branch, typically captured by the following six categories: Agents, Roving Staff, ATMs, Mobile Banking, Internet Banking and Merchant Point of Sale (POS). Most methodologies, too, privilege the moment of contact with the customer as the tell-tale sign to inform channel classification, instead of the technology itself.
Looking Inward
For FSPs, the strategic goals that propel a channel delivery diversification initiative are not inasmuch theoretical, but more, are difficult to isolate and measure. Indeed, many FSPs share similar thoughts on the potential value-added of such initiatives, with commentary emphasizing reduced costs, improved client convenience, new client reach, mobilization of deposits, and a multifaceted income.
However, has group momentum, to an extent, polluted the pacing and progression of ADC deployments? In the hurry of organizations to claim a spot as a 'mover and shover' - which is exacerbated by a fear of forfeiting market position - it seems FSPs have incidentally thrown themselves into the deep end without the metrics that would give them an added life vest and buoyancy.
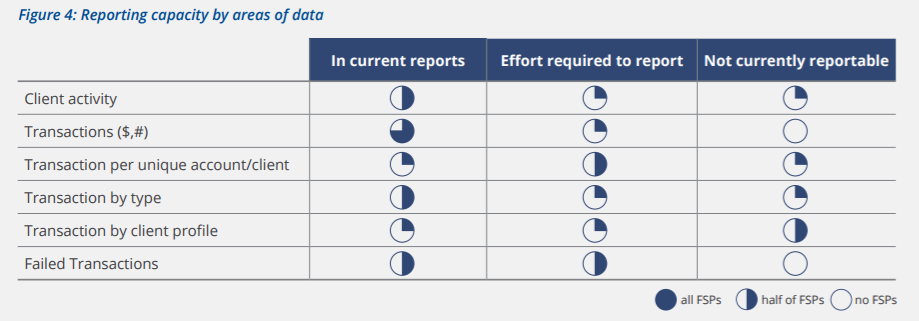
Fortunately, data collecting (and sharing) is on the rise, and through collaborations, like the one orchestrated by MIX, FSPs are becoming increasingly aware and reactive to their own blind spots. According to the report, many FSPs have already put into place at least bare-bone mechanisms to gather channel data.
 Source: MIX, Measuring The Performance of Alternative Delivery Channels
While nearly all of FSPs have invested in reporting capacities that monitor the number and value of transactions, a breakdown of the typology of those transactions is less of a certainty. In the instances where transaction-type behavior is recorded, favorites usually included cash-in cash-out (CICO), airtime top-up, bill payments or account-to-account transfers. To further flesh out the data, transaction activity too is contextualized by its specific channel delivery which allows for a fairly sophisticated dissection of productivity and usage on a channel-by-channel basis.
However, system limitations hinder many FSPs from transcending a channel-centric approach to the data crunching. Few are able to aggregate client behavior across a multiplicity of channels, a crucial piece of the puzzle if FSPs hope to have an accurate picture of net deposit balances. In fact, such deep-dive investigations would illuminate which channels are at the heart of marginal deposit gains, and pump more blood (or here, money) into the arterial network of deposits.
Customer profile compilations at a high level, then, tend to be either very rudimentary or non-existent. Segmenting, even by obvious differentiators like gender or age, are beyond the means of most FSPs. This information gap surely muddies the way forward. What channels drive engagement, and with whom? Do ADCs result in a higher average of balances chaperoned by FSPs, and again, for whom? While the wheels are turning, many FSPs are not yet out of the fog, and do not have the insights needed to make fully informed business decisions.
The More The Merrier
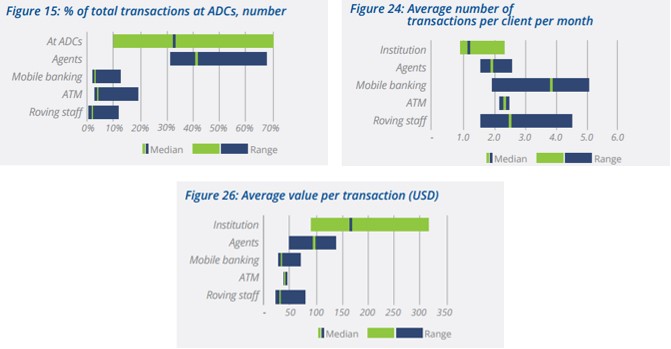
Even with FSPs having a firmer grasp on how ADCs factor into their own operations, how they stack up against others is rarely clear. Slowly, though, industry-wide performance statistics are materializing. The degree to which ADCs are 'stepping up' and shouldering traffic, and the monetary value of the traffic at that, is a focal question to FSPs as they navigate the branch to ADC ratio, and deliberate on the costs associated with each choice.
 Source: MIX, Measuring The Performance of Alternative Delivery Channels
As evidenced by the charts, there seems to be a certain amount of give-and-take in terms of the benefits begot by ADCs. Due to improved customer convenience, it is hypothesized that the frictionless experience of ADCs fosters more frequent usage and savings overall, although at somewhat more modest value increments. This theory is certainly further bolstered by the financial back-and-forth flow of deposits and withdrawals.
 Source: MIX, Measuring The Performance of Alternative Delivery Channels
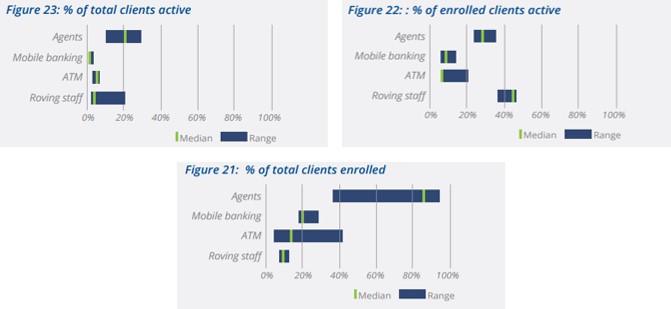
The percent of deposits at ADCs clocks in at 7 percent, a 2 percent bump in contrast to the percent of withdrawals. As a more tangible exercise, that is the equivalent of a 100 USD deposit for every 90 USD withdrawal, a good omen for FSPs who are crossing their fingers that ADCs will mobilize deposits. However, for that outcome to translate on any significant scale, FSPs must first tackle both low enrollment (outside of agents, that is) and activity rates that are, frankly, lackluster with a mere 1 in 5 clients qualifying as such.
 Source: MIX, Measuring The Performance of Alternative Delivery Channels
And, much like the ouroboros, the starting point tumbles into view from the ending point. While the first round of amassing data has lead to some actionable observations, the most obvious of so is, ironically, the conspicuous lack of it (data).
Behavior across channels and segmented user profiles would go a long way in 'troubleshooting' and 'debugging' activity rates, but FSPs suffer from other, equally challenging blinders. There is still little definiteness on what constitutes a 'healthy mix' of channels, what are industry-consistent rates of revenue or new customer acquisition from ADCs, and what (and when) ADCs are most susceptible to system failure (this last bullet is particularly relevant in cases where third parties facilitate transactions AND are tight-lipped on internalities). It seems that for FSPs, there are less elements unknown than there are unsure. Fortunately, between collaboration and cross-pollination, the question marks around ADCs will, with time, morph into serviceable sparks.
Image courtesy of 2010 World Cup - Shine 2010.
Click here to subscribe and receive a weekly Mondato Insight direct to your inbox.

ICOs: A Shortcut To Boom Or Bust?
The Winners And Losers in Mobile Money